Unveiling the Numbers: A Deep Dive into Our Food Blog’s Q3 2023 Traffic & Income
As Quarter 4 unfolds, it brings with it the perfect opportunity to reflect on the performance of the past three months. We’re excited to share our detailed traffic and income data for Quarter 3, offering a transparent look into the journey of a food blog in today’s dynamic online landscape. If you’re new here or simply want to track our progress, feel free to explore our previous traffic and income reports.
This year, we committed to enhancing transparency on our blog by openly sharing our traffic metrics, income streams, and operational expenses each quarter. Our primary goal is to provide valuable insights and practical information for aspiring and established food bloggers alike, especially those contemplating blogging as a full-time career. Beyond assisting our community, this initiative serves as a powerful accountability tool, helping us meticulously manage our finances and continuously refine our business strategies. We believe that by sharing our successes and challenges, we can foster a more informed and supportive blogging ecosystem.
[feast_advanced_jump_to]
Important Notes Before We Begin
Before delving into the specifics of our Quarter 3 performance, here are a few critical points to keep in mind regarding our reporting methodology and recent changes in the digital space:
- Transition to Google Analytics 4 (GA4): Following the shutdown of Universal Analytics in July, all Q3 traffic reports are now exclusively sourced from Google Analytics 4. This transition represents a significant shift in how data is collected and analyzed, focusing more on user-centric events rather than sessions. While we’ve adapted to GA4, understanding its nuances is an ongoing process, and we continue to refine our reporting based on its insights.
- Cash-Basis Accounting for Income and Expenses: It’s important to note that all reported income and expenses represent cash values, not accrual. This means the figures presented reflect the actual money that entered or exited our accounts during each respective month. For instance, advertising networks like Mediavine typically operate on a Net65 payment schedule. Therefore, the income reported for September 2023 corresponds to earnings generated from Mediavine in June 2023. This cash-basis approach provides a clear picture of our real-time financial liquidity.
- Leveraging a Dedicated Team: To maintain the quality and consistency of our content, we collaborate with several skilled contractors. This team plays a crucial role in various aspects of the blog, including specialized blog writing, strategic Pinterest management to drive traffic, professional photo editing, and expert video editing. Outsourcing these tasks allows us to focus on high-level strategy and maximize our creative output.
- Launch of a New Coaching Program: September marked an exciting milestone with the launch of our new food blog coaching program. This initiative is designed to empower other food bloggers with the knowledge and tools they need to succeed. While the program officially commences in January, its successful launch in Q3 significantly impacted our income for that month, as you’ll see in the detailed breakdown.
July 2023: A Strong Start to Q3
July kicked off Quarter 3 with promising numbers, indicating continued growth and stability for the blog. This month saw a healthy net profit, setting a positive tone for the rest of the quarter.
Blog Traffic Performance
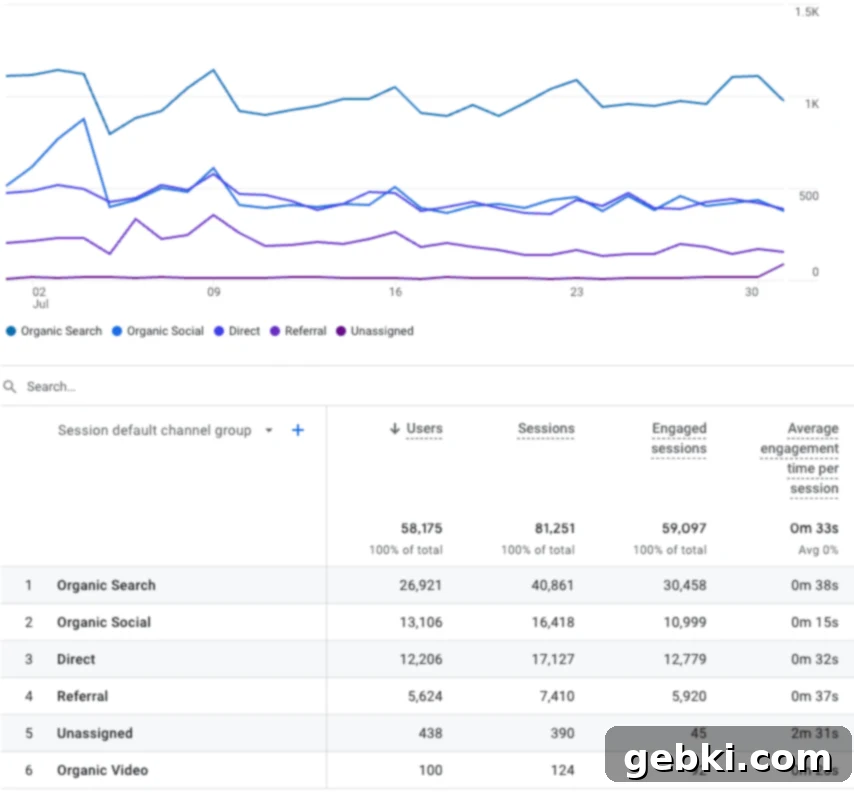
In July, our blog welcomed a total of 81,251 sessions. Consistent with our long-term strategy, the vast majority of this traffic originated from organic search. This reliance on organic traffic underscores the effectiveness of our ongoing SEO efforts and the evergreen nature of our content, which continues to attract readers consistently. Maintaining such robust organic reach, especially as the digital landscape evolves, is a testament to the value and helpfulness of the recipes and articles we publish.
Income Streams
Diversifying income streams is a cornerstone of a sustainable online business. In July, our income was primarily driven by the following sources:
- Mediavine: $1746.55 – This represents our ad revenue, which fluctuates based on traffic volume and ad rates.
- Client Work: $8946.50 – A significant portion of our income comes from client projects, often involving recipe development, food photography, and video creation for other brands and publications.
- Cash Back: $28.55 – Minor earnings from various cash-back programs.
Operational Expenses
Running a professional food blog involves a range of necessary investments to maintain quality and efficiency:
- Adobe Photography Plan: $10.61 – Essential for photo editing and content creation.
- Backblaze: $7.77 – For reliable cloud backup of all our digital assets.
- Calendly: $15 – Streamlines scheduling appointments for client work and coaching calls.
- Canva: $119.40 – Used for graphic design, social media visuals, and promotional materials.
- Clariti: $25 – A valuable tool for content optimization and SEO analysis.
- Collective: $299 – For comprehensive business management and tax services.
- Contractors: $822.48 – Payments for the team assisting with writing, Pinterest, and video/photo editing.
- Google Domains: $12 – For domain name registration and management.
- Grain: $19 – (Specific tool, assumed for video or content creation)
- Epidemic Sound: $49 – Provides royalty-free music for our video content.
- Equipment/Furniture: $139.54 – Investments in tools or workspace enhancements.
- Food/Props: $126.98 – Essential for recipe testing, photography, and video shoots.
- Keysearch: $6.80 – Another critical SEO tool for keyword research.
- Payroll/Owner Expenses: $3136.06 – Compensation for the owner and any payroll-related costs.
- Pixieset: $6.57 – A platform for client photo galleries and delivery.
- QuickBooks: $32.70 – Our accounting software for financial tracking.
- Rank Logic (do not recommend): $47 – An SEO tool that unfortunately did not meet our expectations for value or performance.
- Squarespace: $25.07 – For a secondary website or specific landing pages.
- Termageddon: $12 – Ensures our website’s legal policies are up-to-date and compliant.
Total Income: $10721.60
Total Expenses: $4911.98
Net Income: $5809.62
July proved to be a robust month with a healthy net income, demonstrating effective management of both revenue generation and operational costs. Client work was a significant driver of income this month, complemented by consistent ad revenue.
August 2023: Maintaining Momentum
August saw consistent performance, with traffic figures holding steady compared to July. While income was more tightly balanced with expenses this month, the overall trend remained positive, laying the groundwork for a strong end to the quarter.
Blog Traffic Performance
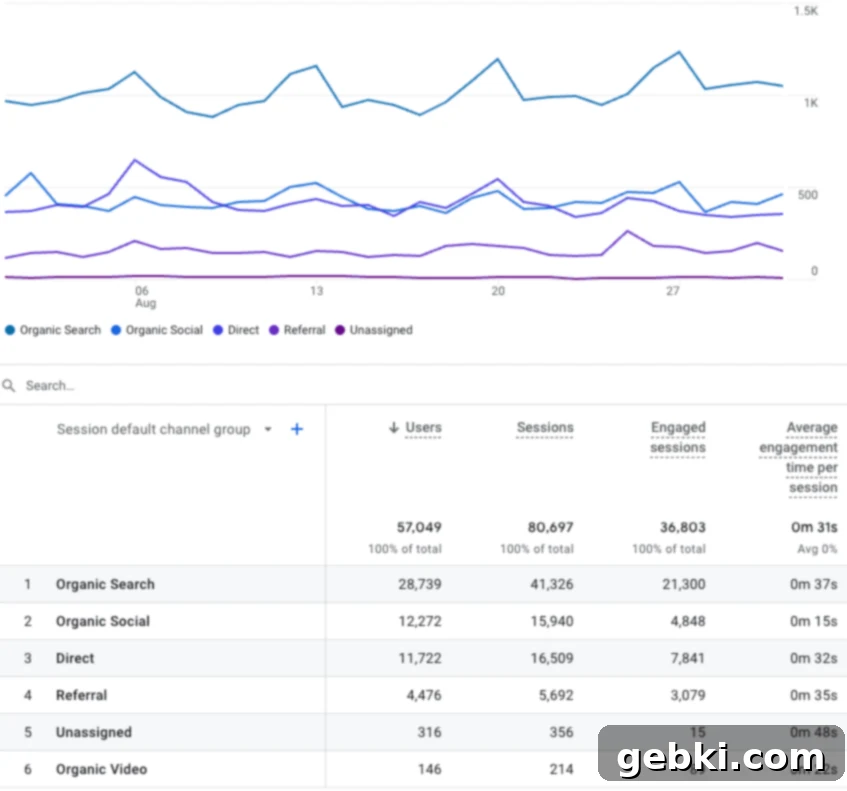
Our blog traffic in August was remarkably close to July’s numbers, recording 80,697 sessions. This steady traffic indicates the sustained appeal of our content and the reliability of our organic search presence. Maintaining such consistent visitor numbers, even during what can sometimes be a slower summer month for many online businesses, highlights the enduring value of our recipe library and SEO optimizations. Despite the slight dip, the strong foundation of our blog ensured continued visibility.
Income Streams
August’s income diversified slightly with the introduction of a new product:
- Mediavine: $1811.16 – Continued strong performance from advertising revenue.
- Client Work: $3000 – A steady stream of income from direct client collaborations.
- Media Kit Template: $10.96 – Our new digital product began generating revenue, albeit a modest amount initially.
- Cash Back Rewards: $16.49 – Additional small earnings.
Operational Expenses
Expenses in August included some annual renewals and ongoing operational costs:
- Adobe Photography Plan: $10.61 – Ongoing software subscription.
- Backblaze: $8.69 – Continued data backup services.
- Calendly: $15 – For efficient scheduling.
- Clariti: $25 – Content optimization tool.
- Collective: $299 – Business management and tax support.
- Complianz: $49 – For cookie consent and GDPR/CCPA compliance on the website. This is often an annual or one-time fee.
- Contractors: $643.58 – Support for content and marketing tasks.
- Google Domains: $12 – Domain upkeep.
- Grain: $19 – (Assumed content or video tool).
- Epidemic Sound: $49 – Royalty-free music subscription.
- Equipment/Furniture: $139.54 – Ongoing investments.
- Food/Props: $96.65 – Ingredients and styling elements for new content.
- Keysearch: $13.60 – SEO keyword research.
- Payroll/Owner Expenses: $3110.60 – Owner compensation.
- Pixieset: $15 – Client photo delivery service.
- QuickBooks: $32.70 – Accounting software.
- Squarespace: $166.61 – A higher expense this month, likely due to an annual or semi-annual subscription renewal for a specific service or site.
- WP Recipe Maker: $99 – An essential plugin for formatting recipes on WordPress, likely an annual renewal.
Total Income: $4838.61
Total Expenses: $4804.58
Net Income: $34.03
August presented a very tight month financially, with income barely exceeding expenses. This was largely due to some higher-cost annual renewals for essential tools like Squarespace and WP Recipe Maker. Despite the slim net profit, maintaining positive cash flow during such months is crucial for long-term sustainability.
September 2023: A Surging End to Q3
September brought a significant upswing in both traffic and income, providing a strong finish to Quarter 3. This surge was driven by strategic content promotion and the exciting launch of a new venture.
Blog Traffic Performance
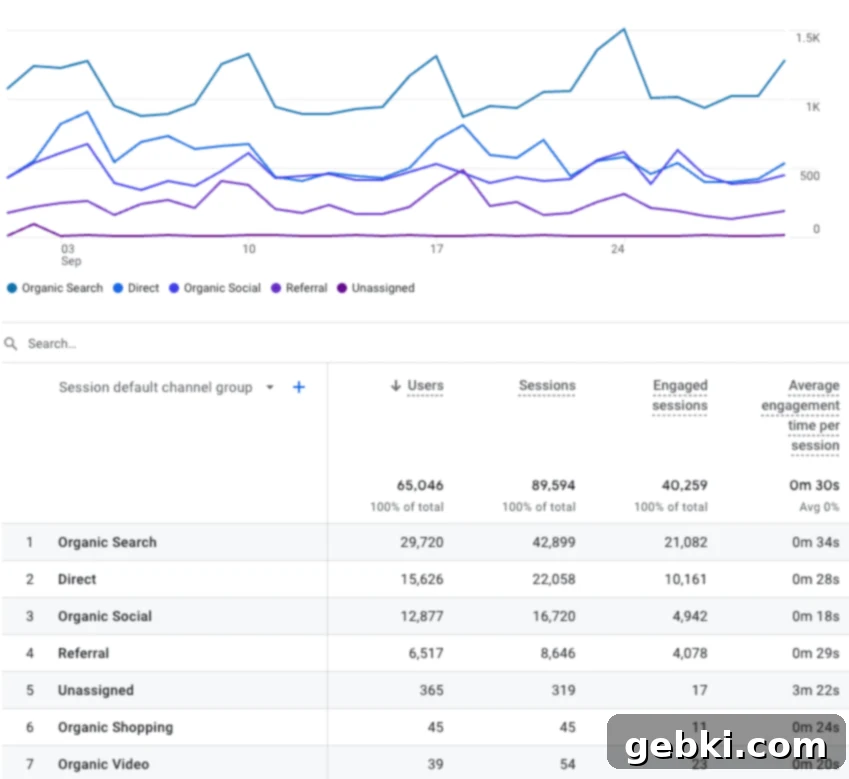
September witnessed a notable increase in traffic, with 89,594 sessions recorded. This pre-Q4 boost was primarily attributed to the strategic sharing of several pumpkin recipes across social media platforms, which resonated strongly with our audience as the autumn season approached. It demonstrates the power of seasonal content and effective social media distribution. Interestingly, we also observed “Organic Shopping” listed as a traffic source in GA4, which is new and requires further investigation to understand its origins and potential.
Income Streams
September saw a significant spike in income, largely due to the successful launch of our new program:
- Mediavine: $1652.92 – Consistent ad revenue from strong traffic.
- Client Work: $3000 – Continued income from client projects.
- Food Blog Coaching: $9586.34 – The launch of our new group coaching program generated substantial income this month, reflecting strong initial enrollment.
- Affiliate: $65 – Earnings from affiliate marketing partnerships.
- Cash Back Rewards: $4.36 – Minor cash back.
Operational Expenses
Expenses remained managed, with some new investments in marketing:
- Adobe Photography Plan: $10.61 – Photo editing software.
- Advertising/Marketing: $263.25 – Investments in promoting the new coaching program and blog content.
- Backblaze: $9.48 – Data backup services.
- Calendly: $15 – Scheduling tool.
- Clariti: $25 – Content optimization.
- Collective: $299 – Business management.
- Contractors: $580.29 – Team support.
- Gifts: $33.33 – Small business-related gifts.
- Google Domains: $12 – Domain costs.
- Grain: $19 – (Assumed content/video tool).
- Epidemic Sound: $49 – Royalty-free music.
- Equipment: $139.54 – General equipment.
- Food/Props: $107.36 – Recipe creation essentials.
- Keysearch: $6.80 – SEO tool.
- ManyChat: $15 – For chatbot marketing and audience engagement, especially useful for program launches.
- Payroll/Owner Expenses: $3110.60 – Owner compensation.
- Pixieset: $15 – Client photo delivery.
- QuickBooks: $32.70 – Accounting software.
- Squarespace: $96.55 – Website/landing page platform.
Total Income: $14308.62
Total Expenses: $4839.51
Net Income: $9469.11
September was an outstanding month, demonstrating the significant financial impact of launching a new, high-value program. The substantial net income reflects both the strong demand for the coaching program and effective cost management, ensuring profitability as we expanded our offerings.
Quarter 3, 2023: An Overview of Performance
Reflecting on Quarter 3 as a whole provides a comprehensive understanding of our blog’s growth and financial health over three months. This period was marked by impressive traffic increases and significant strategic developments.
2023 vs. 2022 Traffic Comparison: Remarkable Growth
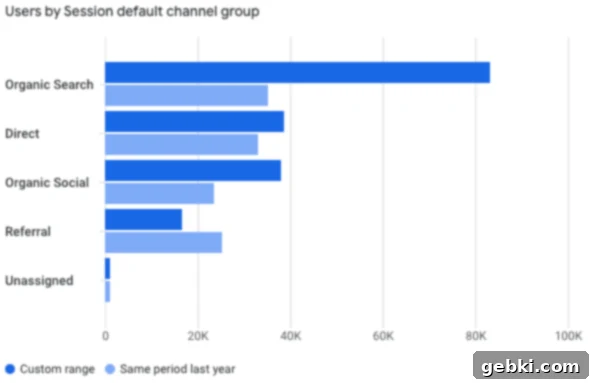
One of the most exciting metrics from Q3 is the substantial increase in sessions: our blog traffic surged by an impressive 60.37% compared to Quarter 3 of 2022. This growth is particularly gratifying when considering that we only published 8 new blog posts during this quarter. This indicates the incredible power of evergreen content and optimized existing posts, which continue to drive consistent organic traffic without requiring a high volume of new publications. It underscores the importance of quality over quantity and the long-term benefits of a strong SEO foundation.
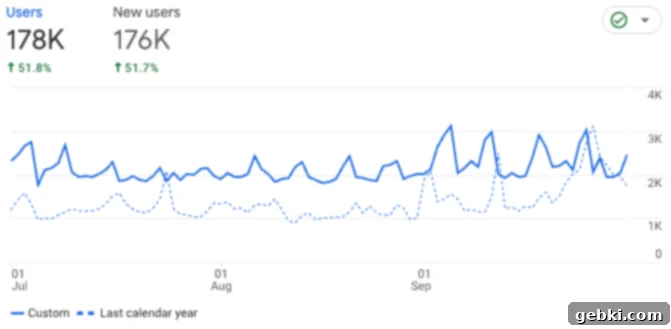
The comparative data also reveals consistent performance across various traffic sources, with organic search remaining the dominant driver, further solidifying our strategy focused on search engine optimization and valuable content creation. This sustained growth provides a strong foundation for future monetization efforts.
Overall Quarter 3 Financial Summary
Combining the monthly figures, Quarter 3 demonstrated robust financial health:
- Total Q3 Income: $29868.83 – A strong showing, significantly boosted by the new coaching program launch and consistent client work.
- Total Q3 Expenses: $14556.07 – Managed expenses, even with some annual renewals and new marketing investments.
- Overall Q3 Net Income: $15312.76 – A highly profitable quarter, reflecting strategic growth and effective financial management.
This net income for Q3 is a clear indicator of the blog’s strong performance and the successful diversification of its revenue streams. It solidifies the blog’s position as a thriving online business.
Looking Ahead to Quarter 4: Excitement and Strategic Focus
As we transition into Quarter 4, there’s a palpable sense of excitement and a clear strategic focus for the months ahead. This quarter holds significant promise for further growth and impact.
I hit a truly monumental milestone this quarter: I’ve officially generated more income from my business in a single year than I ever did working in corporate America. This achievement is not just a personal triumph but a powerful validation of the hard work, dedication, and strategic choices made over the years. It demonstrates that building a successful online business, particularly in the niche of food blogging, offers incredible potential for financial independence and personal fulfillment.
While Quarter 3 brought significant financial success, it also involved a necessary shift in focus. My new coaching program and ongoing client work naturally took priority over publishing a high volume of new blog content. Despite this strategic pivot, I was incredibly pleased to still observe a healthy increase in both blog traffic and ad income. This is a huge reason why I am profoundly grateful for this blog: its foundation of evergreen, high-quality content allowed me to shift my primary attention to new ventures for a period, yet still experience overall gains and continued passive revenue. It speaks to the resilience and long-term value of a well-established content library.
In September, Google rolled out its latest helpful content update, an algorithmic change aimed at prioritizing content created primarily for people, not for search engines. This update had a significant and often negative impact on many recipe blogs that may have focused too heavily on SEO tactics without delivering true value. Thankfully, my blog did not appear to be affected. This is likely due to our consistent focus on creating genuinely helpful, high-quality recipes and articles that serve our audience first. For those who were impacted, I’ve been actively sharing valuable resources and insights via my @foodblogcoach Instagram stories and my Blogging Bites Newsletter, offering support and guidance during this challenging time.
Although I don’t anticipate publishing a large number of new recipes in Quarter 4, I fully expect to see a natural increase in both traffic and income. This anticipated surge is primarily driven by the annual holiday baking season, which consistently brings a significant boost to food blogs as people search for festive recipes and culinary inspiration. Our existing library of holiday-themed content is well-positioned to capture this seasonal traffic.
Over the next few months, my schedule will be quite packed with travel and extensive preparations for my new group coaching program, which is slated to begin in January. The response to this program has been absolutely phenomenal – I’ve been truly blown away by the enthusiasm! We successfully filled 10 of the 12 available spots within just one month of launch, and we’ve gathered an incredible lineup of guest speakers and sponsors who are generously supporting our participants. I am genuinely super excited about the opportunity to connect deeply with and provide impactful assistance to other aspiring and growing food bloggers. This program represents a new chapter of helping others succeed in the space I love.
Thank you for taking the time to read and support my baking blog. I sincerely hope this detailed traffic and income report has provided valuable insights and inspiration for your own blogging journey. I am committed to continuing this transparency, and I look forward to reporting back in January with our Quarter 4 traffic and income figures!
Cheers,
Kayla
